

The prior system I presented, the RSI Hann 1, was based on a John Ehlers’ creation, the RSI with Hann windowing. As I played around with it some more, I thought the signals were good, but there were too many reversals. It brings about some of the same frustration traders have with the Parabolic SAR, which is getting out too early during a trend. Maybe this is not surprising, since the late, great J. Welles Wilder created both technical analysis tools. The RSI fractals idea that I present here uses a similar exit to SAT-007 Fractals 1. That system passed our trading system development process and is currently part of our hypothetical portfolio, trading Heating Oil (HO), so I have confidence in this exit.
I am going to apply this to equities and ETF’s using a weekly timeframe. Given the inherent long bias of the equity markets, I will only go long, which is all that I am permitted to do in live trading currently. Here is a visual representation of the idea:

In my last system, I wrote about grabbing those fat tails. This system should do the same, but catch and hold the tail as long as possible.
Phase 1: Plan & Design
1. Trading Idea
The big idea is to use the RSIH to identify trend direction and fractal or (pivot) Low to exit:
- 13-period RSIH for direction
- 5 bar fractal
- Long entries only, to account for the long bias of equities
- Weekly timeframe
Here is a quick refresher on fractals (or pivots if you prefer). A fractal low occurs over the past 5 bars when:
- First bar Low > Third bar Low
- Second bar Low > Third bar Low
- Fourth bar Low > Third bar Low
- Fifth bar Low > Third bar Low
There are some more nuances to fractals (e.g., you may need more than five bars to form a fractal low), but the idea is generally the same when conditions 3 and 4 are met.
Here is the entry:
- If the RSIH has moved up from the lowest point by .10 or more, then go long next bar at market.
Here is the exit:
- Set initial stop loss to the latest fractal low
- Trail the stop based on each new fractal low that is established
2. System Definition
Indicators:
RSIH, 13-period
- I chose 13 period for the weekly chart, which gives us a 13-week lookback window, which is equivalent to one quarter of a year.
Fractals, 2 bar strength (equivalent to 5 bars)
- This is the regular fractal
Input Parameters:
| Input(Default) | Data Type | Optimizable? | Comments |
| Risk_Capital(2500) | Integer | Yes | Risk_Capital |
| Leverage(4) | Integer | Yes | Multiplier for risk capital |
Variables:
| Variable | Data Type | Default | Calculation |
| RSIH | Double | 0 | RSI with Hann windowing, as described by John Ehlers (see References at the end of this article) |
| Fractal_Low | Double | 0 | Store the latest fractal low |
| NumShares | Integer | 1 | Number of shares to buy or sell |
Initial Capital:
- $50,000
Leverage:
- 4:1
Position Sizing:
- Risk_Capital = $2,500 per symbol (purchasing power = $10,000)
- Number of shares = Risk_Capital / Latest Close Price * Leverage (rounded down)
Entry:
- Long:
- RSIH >= Lowest RSIH + .1
Exit(s):
- Trailing stop, starting with latest Fractal_Low
- Set new stop price when new Fractal_Low is established
Profit Target:
- None
Challenges: None
3. Performance Objectives
The system will meet the following objectives:
| Objective | Goal |
| System Type (trend, mean-reversion, day, swing, etc.) | Trend |
| Risk of Ruin | 0% |
| Profit Factor | >= 1.5 |
| Adjusted Profit Factor | >= 1.0 |
| Win Percent | > 30% |
| Max Drawdown % | < 35% |
| Profit/Drawdown Ratio | > 2.0 (at porfolio level) |
| Ready Date | 2022/01/31 |
For this RSI fractals I am using a new metric, Adjusted Profit Factor, to further filter potentially bad systems and instruments. I won’t get into the math behind this, as it complicates things, but it is one of the metrics provided by my platform. Adjusted Profit Factor is simply a ‘worst-case scenario’ profit factor. If it is greater than 1, we have a high level of confidence of at least breaking even, in theory.
I will discuss this a little more in the Monte Carlo section. A link to a description of this metric is available in the References section at the end of this post.
This idea is S.M.A.R.T.: Specific, Measurable, Achievable, Realistic, Time-bound
4. Market Selection
Markets:
| Energies | Currencies | Fixed Income | Agriculture | Metals | Softs | Indexes | Equities |
|---|---|---|---|---|---|---|---|
| X |
Instruments:
| Market Sector | Instrument | Symbol | Comments |
| Equities | 9 select ETF’s 9 select equities | AAPL, GE, GLW, MTZ, PBR, PG, PPG, T, XRX, FEX, IEV, IJR, ITOT, IVV, NOW, QQEW, SPY, XLE | I will use a set of 9 ETF’s and 9 stocks that I have utilized in other testing. They all have at least 10 years of data and significant volume over those 10 years to justify their usage here. This is the same set I used for SAT-026. |
Chart Type, Timeframe, Session, Time Zone:
| Attribute | Value | Comments |
| Chart Type | Regular Candlestick | Charting is only useful for validating entry and exit signals |
| Timeframe / Interval(s) | Weekly | |
| Session | Regular | |
| Time Zone | Exchange |
Phase 2: Build
5. Manual Test
Pass. The instruments I selected for this RSI fractals system seemed to work just fine.
6. Build
Process Diagram

Comments:
This RSI fractals was easy since I am reusing most of the code from SAT-026 and SAT-007. No bugs and easy sailing.
7. Unit Test
The code works flawlessly. Here is GLW on a chart with this RSI fractals system:

Complete? 
Phase 3: Test
8. Optimization
We are not optimizing parameters for this RSI fractals idea.
Just for fun, I performed optimizations on RSIH length, but the results were no better than a random shuffling of trades. I prefer systems that do not require optimization, so this is perfect for me.
9. Walk-Forward Analysis
I used a walk-forward period from January 1, 2010, to December 31, 2020. This provides 11 years of data, through two difficult drawdown periods for equities (2018 and 2020) while reserving data for at least one year of incubation if we make it that far.
I needed to close out my trades on December 31, 2020, to get accurate profit factors, which is just a nuance of my reporting system. Here are Profit Factor and Adjusted Profit Factors, which provided an initial filter for passing or failing instruments:
| Instrument | Profit Factor | Adjusted Profit Factor | Pass / Fail |
| AAPL | 6.12 | 3.18 | Pass |
| GE | 1.21 | (0.65) | Fail |
| GLW | 2.29 | 1.27 | Pass |
| MTZ | 2.18 | 1.14 | Pass |
| PBR | 3.70 | 2.00 | Pass |
| PG | 2.32 | 1.27 | Pass |
| PPG | 4.23 | 2.24 | Pass |
| T | 1.06 | (0.60) | Fail |
| XRX | (0.93) | (0.49) | Fail |
| FEX | 4.40 | 2.31 | Pass |
| IEV | 1.81 | 1.03 | Pass |
| IJR | 3.78 | 1.89 | Pass |
| ITOT | 4.59 | 2.38 | Pass |
| IVV | 4.67 | 2.40 | Pass |
| NOW | 6.35 | 2.80 | Pass |
| QQEW | 9.83 | 4.51 | Pass |
| SPY | 4.88 | 2.50 | Pass |
| XLE | 1.76 | (0.94) | Fail |
Out of this RSI fractals systems that passed, all met the additional criteria:
- Win Percent > 30% (MTZ squeaked through with 30.7%)
- Max Drawdown % < 35%
- Profit/Drawdown Ratio > 2.0
Here are some additional data points on all 18 symbols, just for our amusement:
- Overall Profit Factor: 2.81
- Max Drawdown: -45.5%
- Max Drawdown Close-to-Close: -31.8%

Treating all instruments as a single portfolio, it probably could be traded as-is. The max drawdown is huge, though the close-to-close drawdown might be tolerable for a patient trader.
This is great! Let us move on to Monte Carlo Simulation with these symbols: AAPL, GLW, MTZ, PBR, PG, PPG, FEX, IEV, IJR, ITOT, IVV, NOW, QQEW, SPY.
10. Monte Carlo Simulation
Before getting into the Monte Carlo simulation, I want to revisit Adjusted Profit Factor, which is one of my newer criteria for success. I have found that the Adjusted Profit Factor is a good predictor of Monte Carlo results, and it may also be a proxy. This will require more testing, to be sure, but once a system has shown an Adjusted Profit Factor of 1 or higher, it has a high probability of passing Monte Carlo simulation. Anything below 1 (or negative, as it appears on reports), has a high probability of failure either in Monte Carlo or incubation. Recall that Adjusted Profit Factor is a worst-case scenario for this RSI fractals system.
From this point, I am going to do something a little different. Given the long timeframe (weekly) and the number of trades per year for each instrument (approximately 2), I will treat all trade results as if they were one instrument. In other words, I will do portfolio-level Monte Carlo testing. I have found that Monte Carlo results tend to be less useful with fewer trades. The one metric that is particularly sensitive is the Return/Drawdown ratio. It is hard to hit 2.0 with a very small sample size. This could be the nature of using equities versus futures or the timeframe. I do not know but I will give some more thought to it.
Here are my results:

As a portfolio, we passed. I also ran this on a few symbols, and they passed, but with low return/DD ratios. It looks like this portfolio of 14 symbols will move to incubation. Happy days!
11. Incubation
It is at this point that the rubber meets the road. How does this RSI fractals system perform on unseen data? My testing period is through January 28, 2022. This has been a precarious couple weeks in the market, so I think it is useful to include messy periods in the market.
One item of note: there are positions that we closed in the Walk-Forward Analysis section at the end of 2020. When running through incubation, trades made in 2020 may not have closed until 2021, so profits showing in 2020 may have been bumped into 2021. If this is confusing, then I feel you. Let us just look at 2020, 2021, and 2022, considering that we are really interested in 2021 and 2022 for incubation.
Here is what things looked like for the portfolio (marked-to-market):

We passed! All symbols proved to be profitable. Trades that closed in 2021 or 2022 are shown here:

This will advance to the deployment phase.
Phase 4: Deploy
12. Production / Portfolio Assignment
It has been more than 9 months since our last system made it this far. This step is like graduation day: the end of one stage of life and commencement of the next. I will assign this portfolio to our hypothetical portfolio. It will be very interesting to see how this plays out, as we are heading into, or perhaps are already in, a bear market regime.
I have no hesitation moving ahead with this RSI fractals. The portfolio will start with week ending February 4th, since I am on a weekly timeframe.
Trading System Result: PASS
Notes and Commentary
There are a lot of different things to consider with this system.
Step 1. Trading Idea
Is the entry relevant? I know this is blasphemy for a systematic trader, but I am wondering if this entry really matters. Is the RSIH a better entry than any other? Aren’t I just capturing a bunch of fat tails, so getting in at any point is a good idea? RSIH, as we learned with the last system, gave a lot of direction changes. I honestly do not believe that we could not have similar results from other types of entries based on price movement. There were some obscene profit factors on some of these, so getting in seems to be less important that just jumping on the train at some point and riding until it crashes. Maybe not the best metaphor, but that’s all I have right now.
Step 4. Market Selection: Selection Bias
How do I avoid selection bias when selecting symbols? Let me explain why I selected the symbols for this system. There were different groups:
- AAPL – Apple, this seems to be an obvious choice for any portfolio, but I included it because it never passed any of the systems I have developed.
- GLW, MTZ, PBR, XRX – These are instruments I have traded successfully as a discretionary trader, but which I have found to have a lot of volatility. I included these because I wanted to see how they would perform in this type of system.
- GE – I picked this because of the distress it has been under for the past few years.
- T – AT&T was selected for variety, and it has been known to mean revert well, so I am told.
- PG, PPG – These are members of the SAT-011 system which are part of our hypothetical system
- FEX, IEV, IJR, ITOT, IVV, NOW, QQEW – just a collection of ETF’s that have sufficient volume for backtesting.
- SPY – Included because I wanted to see how it looked in this system and for comparison against the actual S&P 500 index.
I wanted a messy group, and this is what I picked. Which leads to thoughts about…
Correlation: The last thing we want in a portfolio is correlation of instruments. The group of 18 instruments ended up with correlation that looks like this (after Walk-Forward), from 2010 to 2020:

Anything less than .5 is considered to have low correlation. The ETF’s have a much higher correlation to each other. Maybe some are redundant. I will want to examine this closer in the future.
Is this system worth the effort?
I think about this all the time: can I beat the S&P 500, i.e., can I achieve alpha with this system? I usually sleep well, but if I don’t sleep well, this is what keeps me awake at night. Here are three approaches (assuming 4:1 leverage):
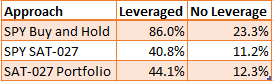
Perhaps it comes down to drawdown. The SPY had a 53% drawdown in the same trading period. The entire portfolio had only 36% drawdown marked-to-market, and about 26% close-to-close drawdown. Maybe that is the trade-off. Also, capital is available for trading other instruments and systems. In a buy-and-hold scenario, you are in 100%. This portfolio was in the market 73% of the time, so lower margin loan costs, though that is blunted by high transactions costs.
This is the challenge of systematic trading: achieving alpha. The SPY by itself may be the better choice. Which leads me to the next section…
Continuous Improvement Department:
My second favorite part of this development process is continuous improvement. I get to come up with a whole bunch for new ideas. This system was taken from one of the last system’s improvement idea, so good things can bloom from this exercise. Here are some things I would like to do with this:
- Add more symbols, between 50 and 100
- Try equities only
- Try ETF’s only
- Filter for symbols with only a positive earnings-per-share (EPS); I do not have easy access to fundamental data now, but it would be great to try this
- Only trade where entry price is less than $50 and greater than $5
- Select symbols in the Russell 2000
There are so many other things I can do with this, but for now let us leave RSIH to rest and move on to the next idea.
Next Trading System Idea: Something mean-reversiony, maybe on Forex.
Do you have a trading idea that you want me to put through our process to see if it would make a valid trading system? Leave a comment below and we can discuss.
Sources/References
- (Yet Another) Improved RSI, John Ehlers, Technical Analysis of Stocks & Commodities, January 2022
- Relative Strength Index – Wikipedia
- Trading Chaos, 2nd edition, Bill Williams
- New Trading Dimensions, Bill Williams
- The Practical Fractal: The Holy Grail to Trading, Bill Williams discussing fractals on YouTube
Did you like what you read? Do you want to see more? Subscribe now and receive our email twice per month, with the Trading System Idea of the Week and other fun stuff.
Don’t worry, we will never, ever, ever sell, overuse, or donate your email address. Promise.
Did you like what you read? Do you want to see more? Subscribe now and receive our email twice per month, with the Trading System Idea of the Week and other fun stuff.
Don’t worry, we will never, ever, ever sell, overuse, or donate your email address. Promise.