

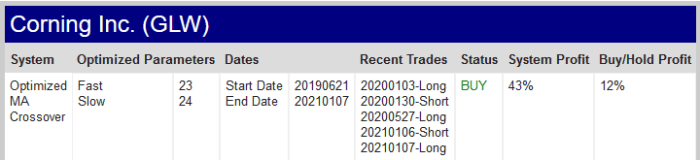
This idea is from Technical Analysis of Stocks & Commodities magazine’s website, https://traders.com . They have three systems that perform hypothetical trades, all of which will be featured here on Systematic Algo Trader. They call this system Optimized Moving Average, and it is a classic moving average crossover system.
They track these systems on their site against most major stocks and indexes. I will test on equities futures and index ETFs, just for comparison, if nothing else. Performance on my mock portfolio on traders.com shows a lot of promise for this system and the other two. This is going to be fun!
Phase 1: Plan & Design
1. Trading Idea
The idea is simple (I know…I say that a lot!):
- Buy when the Fast Exponential Moving Average (EMA) crosses above the Slow EMA
- Sell short when the Slow EMA crosses over the Fast EMA
- This is an ‘always in’ system
- They optimize every 500 days, but I will test using a range of in/out periods (do not worry if you do not know what this means, I will explain in the Optimization section)
2. System Definition
Position Sizing:
I will use the following position sizing:
- Futures: 1 contract
- ETFs: # shares = $10,000 / Close price, rounded down
- Stocks/equities: # shares = $10,000 / Close price, rounded down
Entry:
- Long:
- If Fast EMA crosses over Slow EMA
- Buy next bar at market
- Short:
- If Fast EMA crosses under Slow EMA
- Sell short next bar at market
- Profit targets: None
- Stop Loss: None
Parameters (Default):
I will use the following parameters:
- FastEMA
- SlowEMA
- NumberContracts(1) >> this will vary by instrument
Challenges: None. This system is about as easy as it gets.
3. Performance Objectives
The Optimized Moving Average system will meet the following objectives:
| Objective | Goal |
|---|---|
| Strategy Type (trend, mean-reversion, day, swing, etc.) | Trend Following |
| Risk of ruin | 0% |
| Profit Factor | >= 1.5 |
| Win Percent | >= 30% |
| Max Drawdown % | < 35% |
| Profit/Drawdown Ratio | >= 2.0 |
| Ready Date | 2021/03/12 |
This idea is S.M.A.R.T.: Specific, Measurable, Achievable, Realistic, Time-bound
4. Market Selection
Markets:
| Energies | Currencies | Fixed Income | Agriculture | Metals | Softs | Indexes | Equities |
|---|---|---|---|---|---|---|---|
| X | X |
Instruments:
| Market Group | Instrument | Symbol | Comments |
|---|---|---|---|
| Indexes | Micro E-minis: S&P, Dow, Russell 2000, Nasdaq | ES, YM, RTY, NQ | |
| Equities | Index ETFs Various stocks from Dow, Russell 2000, S&P, and Nasdaq indexes | DIA, QQQ, SPY, IWM | I want to avoid something known as survivorship bias, by looking back at the historical makeup of the S&P, Dow, etc. rather than the current makeup of the indexes. It will be more work, but doing so will avoid bias in that the system performs well because I have stocks that survived and made it onto the Dow, S&P, etc. See the Reference section at the end for details. |
Chart Type, Timeframe, Session, Time Zone:
| Attribute | Value | Comments |
|---|---|---|
| Chart Type | Regular Candlestick | Charting is only useful for validating entry and exit signals |
| Timeframe / Interval(s) | Daily | |
| Session | Regular | |
| Time Zone | Exchange |
Phase 2: Build
5. Manual Test
Okay, I cheated here a little (a lot). Traders.com shows the parameters used and list of recent orders. I picked some random stocks and compared them to a chart. They matched, so I moved on. I essentially let the fine machines over at traders.com do the test for me and I validated it.


6. Build
Process Diagram

Comments:
Sweet and simple.
7. Unit Test
Usually my unit test is complete, but this time I had to return to it after I optimized and did walk-forward analysis. My results looked weird at times when trying to match the results with the values published on the Traders.com website.

The optimization of the Fast and Slow EMA length (the number of bars/periods we use in our calculation) can sometimes result in the Fast length being longer. This is because Traders.com optimizes both lengths using a range of 2-30. I thought about it when writing the rules, but I thought (stupidly) that it would sort itself.
Here is an example of the issue, using the code snippet generated by my optimizer:

I will not bore you with the code details, but I swap the two values when FastLength > SlowLength. Problem Solved.
Complete? 
Note: Unit test verifies that the system is executing the trading rules correctly. It is, essentially, quality control.
Phase 3: Test
8. Optimization
There are two things I will optimize:
- Fast EMA length: range 2 -30, step 1
- Slow EMA length: range 2 -30, step 1
As I mentioned in the Unit Test section, I had to return to unit testing after the optimization revealed some weird things. Thankfully, I was optimizing only several symbols at a time. Optimization can be very time/processor intensive, depending upon the indicators, and Exponential Moving Averages are processor intensive.
I ran all symbols that were on the S&P 500 between 2010 and 2020, excluding recent entrants such as Tesla (TSLA). If a symbol was removed from the S&P 500, then they were not evaluated past the date they were removed. It took a bit of coding to make this all work.
9. Walk-Forward Analysis
To keep it simple, nothing passed: equities, equity futures, and equity ETF’s. It took over 4 days of optimizing and walk-forward to determine that none of the symbols met the goals set in Step 3, Objectives. I will discuss why I believe this failed in the Commentary section
10. Monte Carlo Simulation
Result: No passing instrument for this Optimized Moving Average system.
11. Incubation
Nothing passed, so no incubation period. However, I took two symbols that performed among the best and looked at their performance over 6 months of unseen data. Here are the equity curves over the 11+ year test window, with the incubation period, a/k/a blind walk-forward, highlighted.


Phase 4: Deploy
We did not make it this far.
Notes and Commentary
If last trading idea was a grizzly bear, this one was a goat rodeo. The sheer volume of the symbols meant this almost got out of control, especially as I found several issues that needed to be addressed. Two of the issues that I had were:
- Sometimes the Fast and Slow Lengths for the EMA were the same, resulting in no cross-overs occurring
- Other times the Slow Length was shorter than the Long Length
I had some performance issues, too, but I was able to improve that in the code.
In business school, I learned that large scale projects, such as the design and building of a commercial airplane prototype, will start even when the project managers know there are parts or materials that have not been invented and will need to be discovered or invented by the time they are done. That was my case here. I started without having the tools or knowledge to effectively test the large volume of stock symbols. Hey, I’m a futures guy…call me spoiled. I have technology that simplifies the testing process. However, optimizing and testing almost 600 instruments was a lot. I learned a lot, made a bunch of mistakes, and will be able to handle a larger number of instruments in the future.
Why did this idea fail?
When I looked at the performance on Traders.com, many of the randomly selected symbols showed the Optimized MA system worked better than a Buy and Hold approach over the two year period. I think I know why:
- I did not have the starting date for the system, so I used a fixed date, January 1, 2010, for optimization and walk-forward calculations.
- A lot of stocks performed better during the past year, despite, or perhaps because of, COVID-19. It seems counter-intuitive, but that is what I saw.
It is possible that their results are curve-fit, but my manual testing did not suggest that was the case. I may take one symbol and track it moving forward to see what is happening. I must admit, I do not like optimizing and testing equities.
I am disappointed by the results, but as the Mandalorian states: “This is the way.” There many more ideas to test. Come back next time and see another trading idea put to the test!
Trading System Result: FAIL
——————
Sources/References
Did you like what you read? Do you want to see more? Subscribe now and receive our email twice every month, with the Trading System Idea of the Week and other fun stuff.
Don’t worry, we will never, ever, ever sell, overuse, or donate your email address. Promise.
Did you like what you read? Do you want to see more? Subscribe now and receive our email twice every month, with the Trading System Idea of the Week and other fun stuff.
Don’t worry, we will never, ever, ever sell, overuse, or donate your email address. Promise.
One thought on “Trading Idea #006 – TASC Optimized Moving Average”